






Housing mix
Richmond, CA housing supply, ownership, and rent
What the latest ACS housing mix can and cannot tell buyers and renters comparing options in Richmond, CA.
Source: U.S. Census Bureau

Last updated . Article facts reviewed through this date. Time-sensitive figures show their own as-of dates.
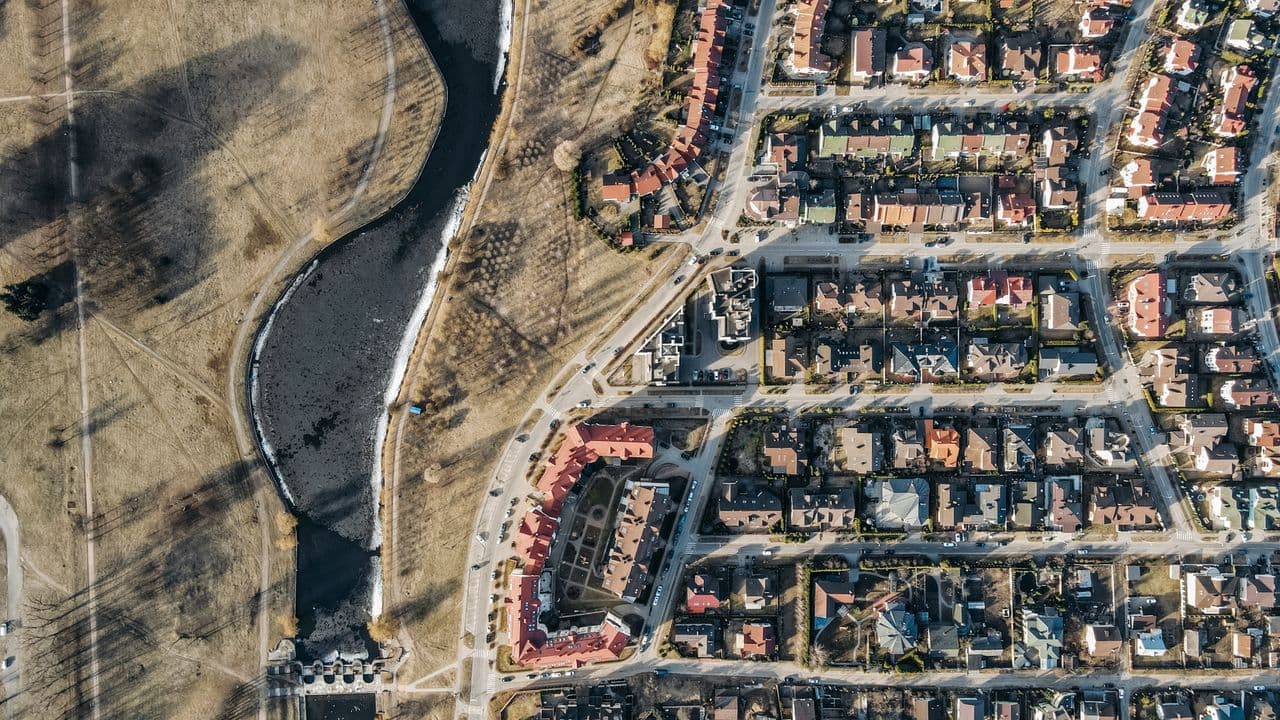
The local figures answer the first question: Richmond, CA's current ACS housing baseline includes 42,509 total housing units, 40,806 occupied units, and 1,703 vacant units. For the decision at hand, those counts may help a borrower establish the scale of the measured housing base before comparing tenure, rent, current listings, property condition, and financing. The figures describe stock across the survey period; they do not say that 1,703 homes were listed for sale or available to rent at one moment. In practical terms, reading 42,509 total units with 40,806 occupied and 1,703 vacant units keeps the release internally grounded while leaving live availability to current listing and property evidence.
Vacant units in Richmond, CA decreased from 2,555 in the prior ACS period to 1,703 in the current release, a reported movement of 33.3%. In the current housing stock, 1,703 units equal 4.0% of the 42,509 total. ACS vacancy covers several statuses, so the 4.0% share cannot be read as the share of homes a buyer can purchase today or the share of rentals immediately available. The movement from 2,555 to 1,703 may still prompt better questions about current for-sale and rental inventory in Richmond, CA, provided those questions are answered with timely listing and property data in place of the survey count alone.