











Typical home value$1,478,916Berkeley citywide · June 2026
Berkeley homebuyer guide
Compare buying a home in Berkeley.
Compare Berkeley home values, ownership costs, housing patterns, local conditions and local buying factors in one practical homebuyer guide.

Annual home value direction2.6% higherBerkeley citywide · June 2026

Population120,257Berkeley citywide · 2020–2024

Homeownership rate44.2%Berkeley citywide · 2020–2024
What homebuyers should know about Berkeley
Berkeley combines its own housing mix, household scale and ownership pattern.
Berkeley has an estimated population of 120,257. Use this citywide figure as broad context alongside local housing and ownership data.
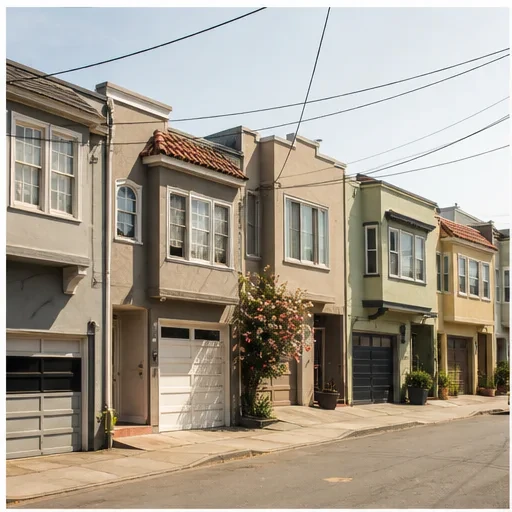
Daily life and home value can change within the same city. Compare commute, street setting, access to work and services, insurance exposure and the property itself instead of treating a citywide number as a neighborhood promise.
Across the 2020-2024 period, 44.2% of occupied homes in Berkeley were owner-occupied, and median household income was $108,092. These citywide figures describe the area overall; neighborhood conditions can differ.
Before making an offer, compare the full monthly housing cost and property condition for every finalist. Include the price, taxes, insurance and any association fees.
The structure type changes the ownership checklist.
Detached, attached, multi-unit and manufactured housing can involve different maintenance, insurance, appraisal and financing questions.
Construction period is a prompt for due diligence.
The year built helps organize questions, but inspection findings and documented upgrades matter more than the decade alone.
Use citywide facts as context, not a personal budget.
47,135Households44.2%Homeownership2,203Veterans
Income, tenure and population describe the city. Your Berkeley price range still depends on income, debts, assets, rate, loan program and complete property costs.
Berkeley housing market
Compare the price and the market direction.
Berkeley city geography · June 2026
Typical home value$1,478,916
Put Berkeley's home value and annual trend in context.
Berkeley's typical home value is $1,478,916, up 2.6% from a year earlier. Use this citywide trend as a starting point, then compare neighborhood listings, property condition and the full monthly housing cost.
Typical home value$1,478,916Berkeley citywide · June 2026
Annual home value direction2.6% higherBerkeley citywide · June 2026
Homeownership rate44.2%Berkeley citywide · 2020–2024
Median household income$108,092Berkeley citywide · 2020–2024
Berkeley planning tools
Monthly payment calculatorPut the local price and property costs into one monthly estimate.
The Berkeley figures above provide citywide context. Enter your own price, cash, taxes, insurance, association costs, and loan assumptions to estimate the complete monthly payment.
 Estimate a complete monthly payment for a home in Berkeley.Estimate principal, interest, taxes, insurance, mortgage insurance, association dues, and cash to close.Calculate a payment→
Housing patterns to compare
Review the citywide housing mix.
Use these citywide categories to guide your property questions. They are not neighborhood names.

54.6% was built before 1940; another 26.4% dates from 1940–1979
Older housing stock
Use this citywide pattern to plan the inspection, then review the age, systems and renovation records of the specific property.
40.4% of housing is single-unit detached
Single-unit detached homes
The citywide housing mix does not describe every block. Compare the lot, exterior, systems and ongoing maintenance alongside price.
59.4% of housing is attached or multi-unit
Attached and multi-unit homes
Use the citywide housing mix as a starting point, then verify the association, insurance, project eligibility, parking and shared-building details.
Housing history and home types
Berkeley's housing eras shape what buyers inspect and budget for.
The Berkeley citywide housing stock spans different construction periods. Those figures are context rather than a neighborhood estimate, and the specific property's condition and records still control the review.

54.6% of local housing predates 1940.
Character and location can be compelling, while electrical, plumbing, foundation, drainage, additions and documentation deserve a property-specific review.

26.4% was built during the mid-century and postwar decades.
Roof, windows, insulation, service panels, sewer lines and prior renovations can vary widely even among nearby homes of the same era.

19.0% was built from 1980 onward.
Newer construction still calls for an inspection plus a review of association reserves, assessments, warranties, permits and neighborhood development.
Education context
Verify the address, district and current school information.
A mailing address in Berkeley does not guarantee a particular school assignment. Check the exact property address with the serving district, then review current public reports rather than relying on a listing label.


Citywide education data is context—not a school rating.
These citywide measures describe education participation and attainment. They do not measure graduation, readiness, attendance or individual school quality. Verify the exact address, serving district and current school reports separately.
Verify addressConfirm districtReview current reports
What ownership costs here
Make condition, housing type and recurring costs part of the Berkeley comparison.
Two similarly priced homes can produce different monthly costs and repair exposure. Review the structure, age, insurance, taxes, association obligations and documented improvements before choosing the better fit.
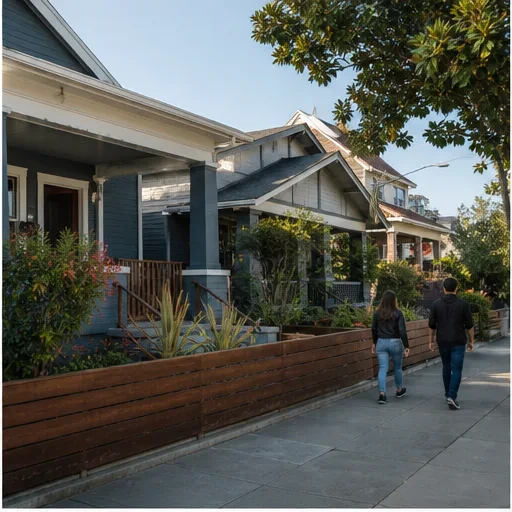
Housing age
54.6% predates 1940 and 26.4% dates from 1940–1979.
Use this Berkeley citywide starting point to organize a focused inspection and records review for the actual home.
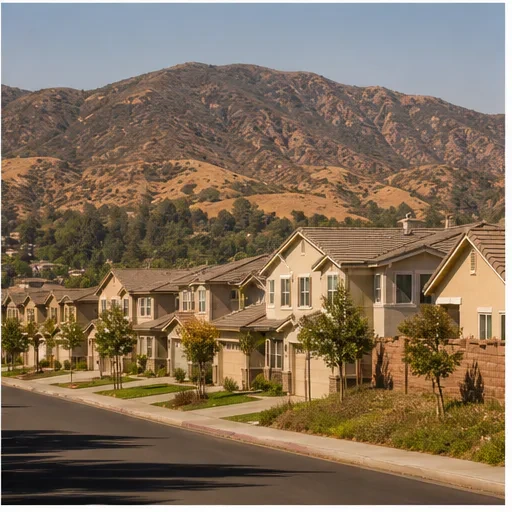
Housing type
40.4% is single-unit detached housing.
The Berkeley citywide mix is context; lot, exterior and system responsibilities at the property determine the true ownership budget.
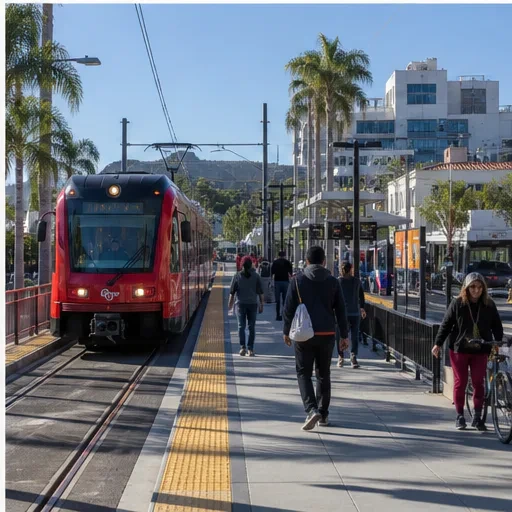
Newer stock
19.0% was built from 1980 onward.
Review warranties, associations, permits, assessments and nearby development even when the home is newer.

Median owner cost with a mortgage$4,001Berkeley citywide · 2020–2024

Owner cost without a mortgage$1,225Berkeley citywide · 2020–2024

Median gross rent$2,133Berkeley citywide · 2020–2024
Housing units53,145Berkeley citywide · 2020–2024

Property tax after closing
Build the current tax bill, reassessment and possible supplemental bill into the first year plan.

Property specific insurance
Price coverage for the exact address before relying on an estimated monthly payment.

Association health
Compare dues, reserves, master coverage and current or planned assessments for condos and planned communities.

Maintenance and climate
Age, heat, salt air, snow, slope and local conditions can change the reserve a home needs.
Nearby markets
Compare Berkeley with nearby cities.
Use the same measure and time period across cities, then open a local guide for property details.
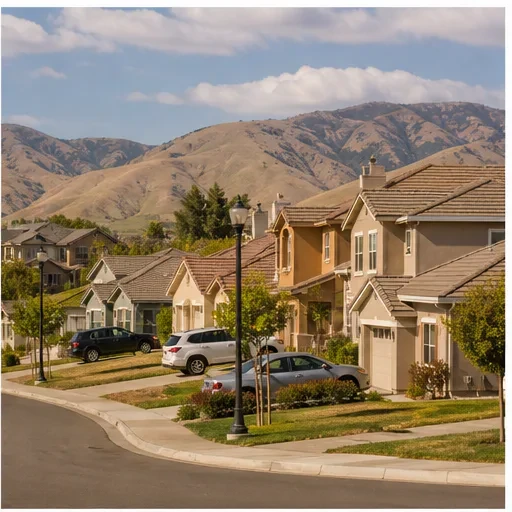 CaliforniaSan Francisco$949K4.2% lower year over yearView the guide
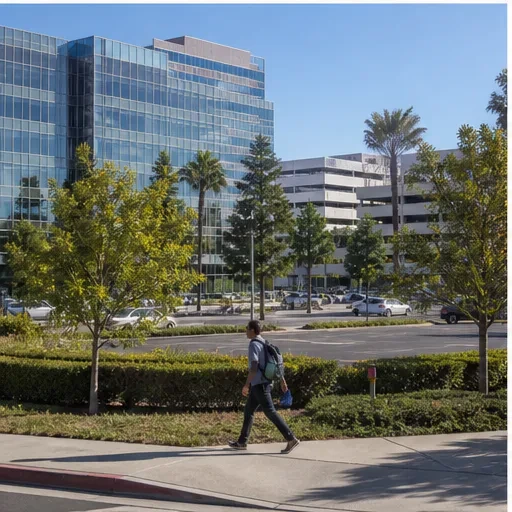 CaliforniaWalnut Creek$1.13MView the guide
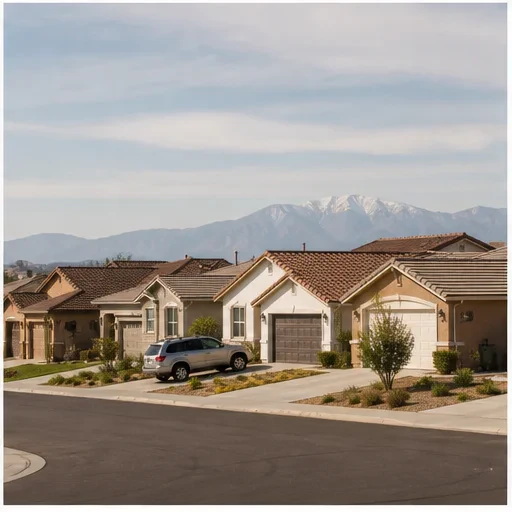 CaliforniaSan Leandro$1.29MView the guideCaliforniaSan Rafael$1.13MView the guideCaliforniaConcord$1.22MView the guideCaliforniaDaly City$1.26MView the guide
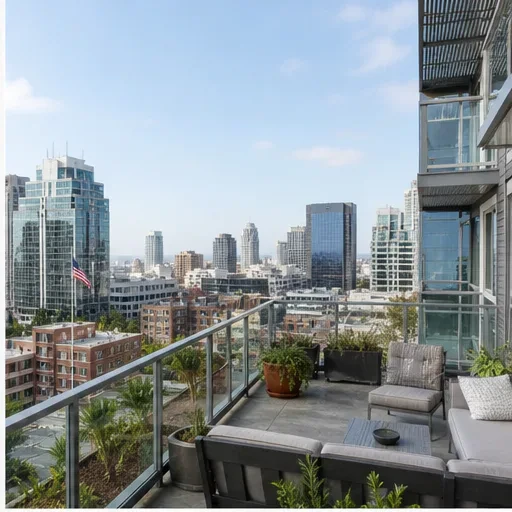 CaliforniaVallejo$1.26MView the guideCaliforniaSouth San Francisco$1.16MView the guideCaliforniaHayward$1.14MView the guide
Berkeley questions
Review the questions that affect a local purchase.
What is a typical home value in Berkeley?
Berkeley's typical home value is $1,478,916, up 2.6% from a year earlier. This citywide estimate reflects the middle tier of local homes; it is not an appraisal or a prediction for a specific property.
How much do homeowners in Berkeley pay each month?
Among existing Berkeley homeowners with a mortgage, the estimated median monthly owner cost is $4,001 for 2020-2024. A new buyer's actual cost will depend on the loan, property taxes, insurance and any association fees.
What is the homeownership rate in Berkeley?
For 2020-2024, 44.2% of occupied homes in Berkeley were owner-occupied. This citywide figure does not determine whether buying or renting is better for one household.
Which schools serve a Berkeley home?
The exact property address determines the serving district and school assignment. Verify the address directly with the district and review current public reports before relying on a listing description.
Which mortgage works best for a home in Berkeley?
The answer depends on credit, income, debts, assets, military eligibility, property type, occupancy, loan amount and how long you expect to keep the loan. Compare total cost and property rules across realistic options.
Does Berkeley use a high-cost loan limit?
For properties in Alameda County, the Calendar year 2026 one-unit conforming limit is $1,249,125. Confirm the property county and number of units because limits are property-specific.
What should I inspect in an older Berkeley home?
Start with a general inspection, then follow findings with appropriate specialists. Roof, wiring, plumbing, sewer, foundation, drainage, HVAC, additions, permits and insurance eligibility often deserve extra attention.
How should I compare nearby cities with Berkeley?
Compare the same measure, geography and time period for every city. Then weigh the full monthly housing cost, commute, home type, condition and available inventory; a lower headline value does not always mean a lower total cost.
Prepare for the local search
Get prequalified before you tour homes in Berkeley.
Use prequalification to compare the local market with a budget based on your information.